
MACD vs RSI is the wrong question if you ask it as a duel. The right question is which job each indicator does on a 5-minute chart, and what each one costs you in false signals. This comparison answers that: a criteria table first, then the cost math for both setups, then a combined MACD + RSI setup on M5 with numbered rules. The verdict depends on the trader type, and the section before the FAQ gives it per type.
Neither indicator wins outright for scalping. RSI 9 reacts faster and times entries; MACD 12/26/9 filters the trend and keeps you out of counter-trend trades. Used together on M5, RSI triggers the entry and MACD confirms the direction. The deciding factor is cost: the tighter the stop, the more each false signal hurts.
What each indicator actually measures
RSI, the Relative Strength Index, is a bounded oscillator that measures the speed and size of recent price changes. It runs on a 0–100 scale: above 70 is conventionally overbought, below 30 is oversold, and 50 is neutral. It was introduced by J. Welles Wilder Jr. in 1978. The standard setting is 14 periods, but 14 is slow for scalping: our own RSI scalping strategy compares RSI 7, 9 and 14 and uses 7–9 for M5 entries, because a shorter lookback reacts sooner.
MACD, the Moving Average Convergence Divergence, tracks the relationship between two exponential moving averages. The standard setting is 12/26/9: the MACD line is the 12-period EMA minus the 26-period EMA, the signal line is a 9-period EMA of the MACD line, and the histogram shows the gap between them. MACD is unbounded and trend-following, developed by Gerald Appel in the late 1970s.
The structural difference decides everything else. RSI is fast and reactive: good at timing entries, bad at telling you whether the trend will continue. MACD is slower and smoother: good at confirming direction, bad at timing a precise entry. On a scalping timeframe that difference is measured in pips — a late MACD crossover can eat half the move, and an early RSI extreme can fire three times before the reversal comes.
The criteria table
| Criterion | MACD 12/26/9 | RSI 9 |
|---|---|---|
| Speed | Slower; crossover lags price by several M5 candles | Faster; reacts within one or two M5 candles |
| False signals | Fewer in trends, frequent crossovers in chop | Frequent at extremes in strong trends |
| Best market | Clean trend, London session, post-news momentum | Defined range, pullbacks inside a trend |
| Best timeframe | M5 for bias, M15 for confirmation | M5 entries, M1 for trigger timing |
| Signal type | Line crossover, zero-line cross, histogram change | Cross back from 70/30, divergence, 40–50 zone |
| Cost sensitivity | Lower; wider stops absorb the spread | Higher; tight stops make every pip count |
Read the table as a division of labour, not a scoreboard. MACD tells you whether to trade and in which direction; RSI tells you when to pull the trigger. Using MACD for entries costs you its lag; using RSI for direction costs you counter-trend losses.
The cost math for both setups
Costs decide which indicator pays, because the two setups run different stops. The assumptions are the same ones used across this site's scalping guides, labelled so you can rerun the table with your own broker's numbers: EURUSD on a raw account, spread 0.8 pip, commission $0.35 per 0.1 lot per side ($0.70 round turn, or 0.7 pip at $1 per pip per 0.1 lot), slippage 0.2 pip. Total round-turn cost: 1.6 pips.
The MACD trend setup runs wider stops, because trend entries need room: a 10-pip stop with a 15-pip target at 1.5R. The RSI range setup runs tighter stops, because range entries sit close to the level: a 6-pip stop with a 9-pip target at 1.5R.
| Setup | Stop | Target (1.5R) | Cost | Cost as share of target |
|---|---|---|---|---|
| MACD trend | 10 pips | 15 pips | 1.6 pips | 11% |
| RSI range | 6 pips | 9 pips | 1.6 pips | 18% |
The RSI setup pays a higher share of every win to costs, which is why its break-even win rate is higher at every reward level. Break-even win rate = (stop + cost) / (stop + target):
| Reward | MACD setup, no costs | MACD setup, with costs | RSI setup, no costs | RSI setup, with costs |
|---|---|---|---|---|
| 1R | 50.0% | 58.0% | 50.0% | 63.3% |
| 1.5R | 40.0% | 46.4% | 40.0% | 50.7% |
| 2R | 33.3% | 38.7% | 33.3% | 42.2% |
Two conclusions follow. First, the MACD trend setup is cheaper: at 1.5R it breaks even at 46.4% after costs, against 50.7% for the RSI range setup. Second, neither setup survives a 1R target after costs — 58% and 63% break-even rates are not a plan. Both setups target 1.5R as the minimum, and the combined setup below uses the MACD stop with the RSI trigger, the cheaper combination.
The combined setup: MACD bias, RSI trigger, M5
The ranking guides for this keyword are general trading articles, not scalping guides. None gives M1/M5 settings, cost math, or a spread filter, and none writes the combined setup as numbered rules. This section does all four.
Settings: MACD 12/26/9 (standard), RSI 9, M5 chart, H1 for bias. Some guides speed MACD up to 5/13/1 for faster histogram signals, but that setting whipsaws more, so this setup keeps 12/26/9 and lets RSI do the fast work.
Long rules. Shorts are the exact mirror image.
- H1: MACD histogram is above zero and the MACD line is above the signal line. That is the bias: longs only.
- M5: price pulls back and RSI 9 dips to the 40–50 zone — a normal pullback in a healthy uptrend, not a reversal.
- Trigger: RSI 9 turns back up from the 40–50 zone and closes above 50 on M5.
- Confirmation: the MACD histogram on M5 is above zero, or ticking higher toward it, at the moment of the RSI trigger. If the histogram is still below zero and falling, the trade is invalid.
- Entry: at the open of the next M5 candle after rules 3 and 4 are both true.
- Stop: 1–2 pips beyond the pullback swing low, plus the spread. If that stop is wider than 10 pips, skip the setup.
- Target: 1.5R. Close half at 1R, move the stop to breakeven, and exit the rest when RSI 9 reaches 70 or the MACD histogram shrinks for two consecutive M5 candles, whichever comes first.
The range variant uses the same indicators with different RSI levels: in a confirmed range, wait for RSI 9 to push above 70 and cross back below it for a short, or below 30 and cross back above it for a long, with the MACD histogram confirming the direction. Never run it when rule 1 shows a strong trend — the most common way RSI scalpers lose money.
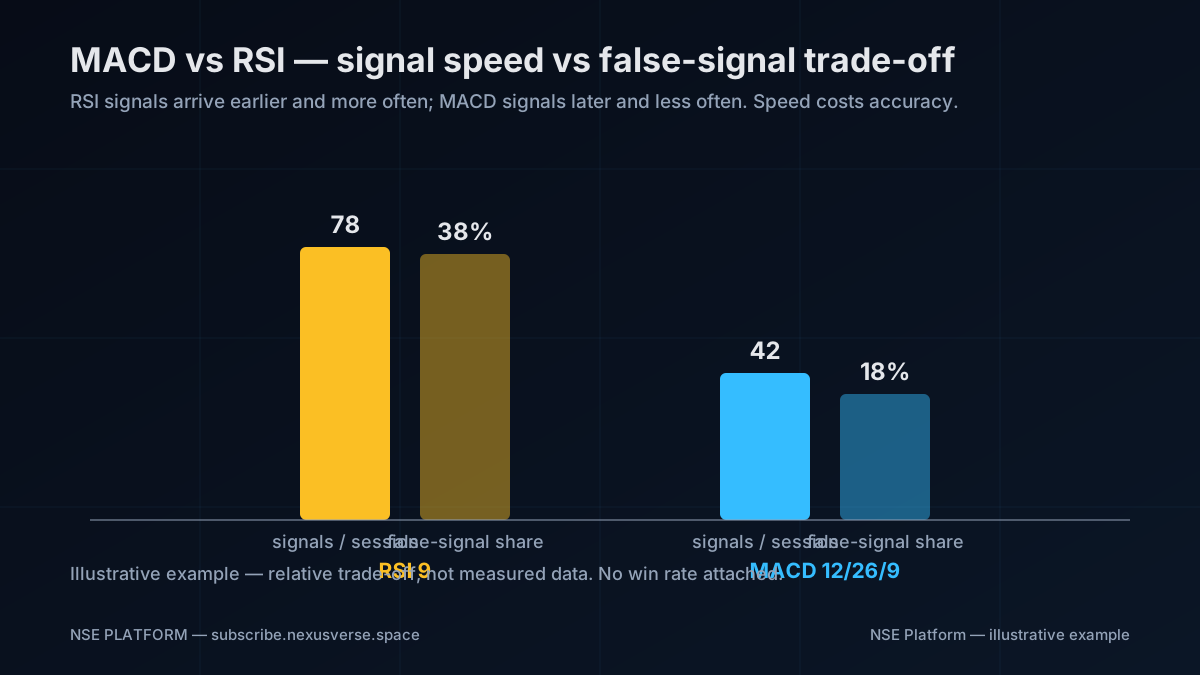
The chart above shows the trade-off: RSI signals arrive earlier and more often, MACD signals later and less often, and the false-signal rate rises as signal speed rises. It is an illustrative example, not measured data — no study behind it, no win rate attached.
Worked example: EURUSD on M5
Example — not live prices. The numbers below illustrate the position-size formula; they are not a real trade or a price forecast.
- Account: $5,000.
- Risk per trade: 0.5% of the account = $25.
- Stop distance: 7 pips.
- Pip value: 0.1 lot of EURUSD = $1 per pip.
Position size = risk dollars / (stop in pips × pip value per 0.1 lot) = $25 / (7 × $1) = $25 / $7 = 3.57 units of 0.1 lot, which is 0.357 lots.
Round down to 0.35 lots, never up — rounding up would push the risk above 0.5%. At 0.35 lots, one pip is worth $3.50.
- Target at 1.5R: 10.5 pips. Gross win = 10.5 pips × $3.50 per pip = $36.75.
- Round-turn cost: 1.6 pips × $3.50 per pip = $5.60.
- Net win after costs: $36.75 − $5.60 = $31.15.
- Partial at 1R (7 pips): close half for a gross $12.25, move the stop to breakeven, and let the rest run to the RSI 70 exit or the histogram exit.
When NOT to use each indicator
Do not use RSI extremes in a strong trend. RSI can sit above 70 for hours while price keeps climbing, and below 30 for hours while price keeps falling. Selling every RSI 70 print in an uptrend, or buying every RSI 30 print in a downtrend, is the most expensive beginner mistake with this indicator. In a trend, use the 40–50 zone, never the 70/30 extremes.
Do not use MACD crossovers in chop. In a range, the MACD line crosses the signal line repeatedly and each cross looks like a trade. It is not. When the H1 histogram is flat near zero and price moves sideways, MACD has nothing to confirm, and every crossover is noise.
Do not trade divergence alone. Both indicators print divergence — price makes a new high while the indicator does not — and it can persist for many candles before price turns. Treat it as a warning to tighten stops or skip entries, not as an entry signal.
Do not scalp either indicator around red-folder news. Five minutes before to five minutes after CPI, NFP, FOMC decisions and rate announcements, spreads widen and both indicators print signals on moves that reverse in seconds.
Verdict per trader type
- Trend scalper — MACD bias + RSI trigger. Run the combined setup exactly as written. MACD keeps you on the right side of the trend, RSI times the pullback entry, and the wider stop keeps costs at 11% of the target.
- Range scalper — RSI extremes + MACD filter. Trade the range variant only when H1 shows a flat histogram and price moves between clear levels. RSI 9 crossing back from 70/30 is the entry; the MACD histogram must agree, or the trade is skipped.
- Beginner — RSI 9 only, first. Learn one indicator before combining two. Trade RSI 9 pullbacks in the 40–50 zone inside a trend identified from price structure alone, with the same 0.5% risk and 1.5R target. Add MACD once twenty journaled RSI trades show you follow the rules.
There is no trader type for whom MACD crossovers alone, on M5, are the answer. The crossover is the slowest signal here, and on a 5-minute chart it hands back too much of the move.
Risk rules
- Risk 0.25–0.5% of the account per trade, sized from the stop distance with the division shown in the worked example.
- Daily loss limit of 2%: when the day's losses reach 2% of the account, stop trading for the day.
- Three-loss pause: after three consecutive losing trades, stop for at least 30 minutes and review the log.
- Spread filter: skip the trade when the spread is above 20% of the target — above 2.1 pips for the combined setup's 10.5-pip target.
- Never move a stop further away, and never add to a losing scalp.
Six mistakes and how to fix them
- Selling RSI 70 in an uptrend. It can stay overbought while price climbs. Fix: in trends, trade the 40–50 zone, never the extremes.
- Trading every MACD crossover. Crossovers in a range are noise. Fix: require the H1 histogram above zero and a pullback structure first.
- Using RSI 14 on M5. The default setting lags the move. Fix: RSI 7–9 for scalping, RSI 14 for M15 and above.
- Ignoring the cost share. A 6-pip stop with a 9-pip target gives costs 18% of the win. Fix: run the cost table first, and prefer the wider-stop variant.
- Entering on divergence alone. Divergence warns; it does not trigger. Fix: wait for the RSI cross back and the MACD histogram confirmation.
- No spread filter. A setup that works at a 0.8-pip spread fails at 2.5 pips. Fix: check the spread at entry; skip above 20% of the target.
FAQ
Is MACD or RSI better for scalping?
Neither is better in general. RSI 9 is better for timing entries because it reacts faster; MACD 12/26/9 is better for filtering direction because it follows the trend. For pure speed, RSI edges ahead; for trend days, MACD keeps you out of losing counter-trend trades. The combined setup uses RSI for the trigger and MACD for the bias.
Can you use MACD and RSI together for scalping?
Yes — that is the setup this article teaches. MACD on H1 sets the bias, RSI 9 on M5 times the pullback entry in the 40–50 zone, and the MACD histogram on M5 confirms the direction. Both must agree before entry; if either disagrees, the trade is skipped.
What are the best MACD settings for scalping?
The standard 12/26/9 works when RSI does the fast timing, because MACD's job is the trend filter, not the entry. Some guides speed MACD up to 5/13/1 for a faster histogram, but that setting whipsaws more in chop. Keep 12/26/9 unless you have tested 5/13/1 on history with the same rules.
What are the best RSI settings for scalping?
RSI 7–9 on M5. A 9-period RSI reacts fast enough to time pullback entries without firing on every tick; a 7-period RSI is faster still but noisier. The default RSI 14 is too slow for M5 and belongs on M15 and above. Our RSI scalping strategy compares RSI 7, 9 and 14 in detail.
Related reading
- RSI scalping strategy — RSI 7/9/14 compared.
- Best indicators for scalping — the Indicators & Tools Hub pillar.
- EMA scalping strategy — the 9/21/50/200 stack.
- VWAP scalping strategy — the VWAP bounce setup.
Sources consulted
- Stocks365 — "MACD vs RSI: The Ultimate Momentum Indicator Guide" (RSI/MACD mechanics, combined approach). https://www.stocks365.com/blog/macd-vs-rsi-the-ultimate-momentum-indicator-guide
- RSIIndicator.com — "RSI vs MACD – Which Indicator Is Better for Timing Trades?" (core differences table, timeframe guidance). https://rsiindicator.com/rsi-vs-macd/
- OpoFinance blog — "The 3 Best Momentum Indicators for Scalping" (RSI 7–9 settings, MACD 5/13/1, combined system). https://blog.opofinance.com/en/best-momentum-indicators-for-scalping/
Educational material only — not financial advice. Forex and gold trading with leverage can produce substantial losses. Backtest and demo-trade any setup before risking real capital.